AI’s Uneven Takeoff: Insights from Anthropic’s 2025 Economic Index on Work Transformation
AI’s Uneven Takeoff: Insights from Anthropic’s 2025 Economic Index on Work Transformation
Artificial intelligence (AI) is rapidly gaining traction, but the pace and manner of this adoption vary significantly. Over the past two years, the percentage of U.S. employees utilizing AI at work surged from 21% to 40%. However, a closer examination reveals stark disparities across countries, states, industry sectors, and collaboration styles. Anthropic’s September 2025 Economic Index report elucidates these trends while providing a detailed view of enterprise AI deployment through API usage. The findings highlight both the swift advancements of AI technology and the uneven distribution of its benefits and challenges.
This guide simplifies the report for a non-expert audience keen to understand the complexities of AI adoption. You will discover where AI usage is concentrated, how it is shifting, the unique patterns emerging within enterprises, and what this data means for productivity, policy, and the workforce.
- Who this is for: Leaders making investment decisions, operators designing AI workflows, researchers monitoring AI diffusion, and professionals adapting to evolving workplace expectations.
- What you’ll learn: Insights into regions with the highest AI usage per capita, the importance of capabilities over costs in enterprise adoption, shifts in collaboration styles, and the factors that may either widen or close emerging gaps.
What is the Anthropic Economic Index?
Anthropic’s Economic Index (AEI) is a recurring analysis that examines actual usage patterns of its AI assistant, Claude. The September 2025 edition broadens its scope by introducing geographic data on Claude.ai conversations across more than 150 countries and all U.S. states. Additionally, it offers a pioneering examination of enterprise AI usage through first-party API data. This report not only updates time-series trends of Claude.ai usage but also provides fresh insights into adoption concentration and business implementations of AI today.
Why This Matters
Historically, transformative technologies diffuse across the economy over years or decades, often starting in a few regions and limited tasks. AI appears to be following this same trajectory, albeit at an accelerated pace and with more pronounced effects.
Key Takeaways at a Glance
- Rapid Yet Uneven Adoption: Workplace AI usage has nearly doubled since 2023, but its distribution varies widely across geographical and sectoral lines.
- High-Income Regions Lead AI Use: Smaller, tech-forward economies and specific U.S. hubs exhibit disproportionately high levels of AI usage per person.
- Shifting AI Use Patterns: More users are delegating end-to-end tasks on Claude.ai, particularly in education and scientific fields, marking a shift from debugging to creating new code.
- Automated Enterprise Deployment: The majority of API usage focuses on coding and administrative tasks, with 77% of interactions showing automation trends, indicating a weak sensitivity to task costs.
- Context as a Bottleneck: Many advanced uses hinge on effectively providing the right organizational context, often necessitating data modernization and new operational methods.
How Usage on Claude.ai Evolved in 2025
Anthropic analyzes anonymized, privacy-preserving samples of Claude.ai interactions to understand collaboration shifts. During the eight months leading up to August 2025, three notable trends emerged:
-
Growth in Education and Science Tasks: The percentage of education-related tasks increased from approximately 9% to over 12%. While coding remains significant (accounting for about a third of usage), this indicates a broader diffusion into knowledge-intensive areas prioritizing reasoning and explanation.
-
Shift from Correction to Creation in Coding: The proportion of conversations focused on creating new code surged, while debugging activities declined. Users are becoming more efficient, likely due to improved model capabilities and increased confidence in delegating tasks.
-
Move Towards Automation Modes: Collaboration styles are transitioning away from back-and-forth interactions towards more directive, task-oriented engagements. Consequently, automation interactions have surpassed augmentation for the first time, marking a significant development in day-to-day work applications of AI.
Implications
If the rise in directive usage primarily stems from more capable models, the range of automatable tasks is likely to broaden. Conversely, if driven by experiential learning, those who adapt quickest may achieve the most significant gains. Both dynamics are probably at play, influencing training, workflow design, and job quality.
Regional AI Usage: Where It’s Strongest and Weakest
To analyze usage patterns globally, Anthropic introduces the Anthropic AI Usage Index (AUI), which measures whether AI usage is over- or underrepresented relative to a region’s working-age population.
Global Patterns
- Leading High-Income Economies: Countries like Israel, Singapore, Australia, New Zealand, and South Korea excel in AI usage per capita. The U.S. also ranks favorably in per-capita terms.
- Income Correlates with AI Usage: Across countries, AI usage per person tends to increase with GDP per working-age capita, reflecting patterns observed during previous technology waves.
- Lagging Lower-Income Regions: Many nations in Africa, Latin America, and parts of Asia display lower AI adoption rates than their population share would suggest, including India, Indonesia, and Nigeria.
Reasons for Disparities
Factors such as digital infrastructure, the nature of employment (knowledge work vs. manual labor), regulatory environments, and public trust significantly influence AI adoption trends. These elements either facilitate or hinder usage.
U.S. Patterns
- Concentration in Major States: While total AI usage is high in states like California, New York, Texas, and Virginia, per capita metrics reveal a more nuanced dynamic. For instance, the District of Columbia and Utah demonstrate higher AUI ratings, illustrating unique local economic specializations and usage contexts.
Differences in Use Cases
- In regions with lower adoption rates, coding constitutes a greater share of AI activity, while areas with higher adoption exhibit broader usage across education, science, and business sectors. High-AUI countries also show a preference for collaborative, supportive workflows over strict automation, even after accounting for variations in task type.
The crucial takeaway: Without targeted initiatives to bolster AI capacity in underrepresented regions, productivity benefits could increasingly concentrate in already prosperous areas, exacerbating global and domestic inequalities – a trend observed in many previous technology advances.
Insights from Enterprise API Data
The report’s enterprise segment analyzes a significant anonymized dataset of first-party API traffic—programmatic interactions with Claude that power various applications. This analysis reveals how early adopters implement AI beyond mere experimentation. Key findings include:
-
Predominantly Automation-Driven Usage: API requests lean heavily towards software development and administrative tasks, with educational and creative applications taking a back seat. Notably, 77% of business interactions demonstrate automation characteristics, highlighting a shift towards end-to-end execution.
-
Prioritizing Capabilities Over Costs: The enterprise tasks that are most common often involve high costs per interaction, indicating weak price sensitivity. Companies seem to favor capabilities that offer tangible value over cost per task when evaluating potential uses for AI.
-
Context is Critical: Successful, sophisticated AI deployments hinge on accurate and relevant organizational context. Firms may need to revamp their data infrastructure and streamline how teams relay information to models to ensure optimal use of AI.
Alignment with Public Data
The enterprise findings align with broader U.S. statistics indicating that AI usage among firms is still emerging, with significant disparities based on sector and company size. Recent surveys show overall adoption rates remain single-digit, with higher engagement in the Information sector and larger companies.
Conclusion from Findings
Consumer and employee-reported AI usage can appear high—40% of workers claim to use AI at least occasionally—while formal integration within companies struggles to catch up. This disparity highlights the distinction between casual use and robust, programmatic deployment, with businesses currently favoring areas where they can accomplish automation most effectively.
Implications for Productivity and Employment
- Productivity Improvements: As work transitions from iterative processes to more directive completion models, throughput may increase, but quality remains contingent on proper prompts and contextual understanding. Maximizing productivity necessitates redesigning workflows to rely on the strengths of AI models rather than simply replacing traditional steps.
- Evolving Skill Demands: As AI adoption in education and science expands, demand grows for professionals who can convert complex problems into well-structured instructions and assess outputs. These “AI project management” skills are becoming vital in knowledge work environments.
- Addressing Inequality: Failing to invest in regions currently experiencing low AI adoption may mean that productivity benefits will continue to converge on areas and organizations already poised to leverage AI advancements. Policymakers should monitor trends in AI usage concentration and invest in necessary infrastructure, training, and resource access.
Practical Guidance: Leveraging This Data
For policymakers and civic leaders:
– Focus on Investment in Low AUI Areas: Prioritize infrastructure improvements, broadband access, and training in regions exhibiting low AI usage.
– Monitor Usage Diversity: Encourage diverse applications beyond coding to foster resilience and versatility in regional AI adoption strategies.
– Support Open Data Initiatives: Promote transparency in data and usage metrics to guide evidence-based policy decisions and practices.
For enterprise leaders:
– Start with Feasible Automation Projects: Identify and scale automation opportunities in programmatic workflows, subsequently enhancing context and complexity.
– Evaluate Collaboration Modes: Monitor the balance between directive automation and iterative work to effectively integrate AI agents into processes.
– Focus on Capabilities and Outcomes: Look beyond simple cost metrics, prioritizing overall project value and results.
For practitioners:
– Hone Context Craftsmanship Skills: Develop the ability to curate necessary documentation and instructions for AI models.
– Experiment with Directive Prompting: Aim for complete deliverables and evaluate them rigorously for quality.
– Track Personal AI Workflows: Create an inventory of tasks where AI contributes significantly, and delineate areas needing human oversight.
Methodology and Ethical Considerations
- Privacy Protections: Data sampling for geographic analysis uses anonymized, privacy-guarded interactions with Claude.ai, while enterprise data represents a broad API traffic overview.
- Timeframes of Analysis: Observations in the report compare recent snapshots against earlier data to highlight noticeable shifts aligned with product developments.
- Caveats: It’s important to remember that usage shares don’t fully represent overall adoption, and enterprise API data primarily reflects early adopters. Firm-level surveys can complement macro insights.
FAQs
What is the AUI, and how does it differ from adoption rates?
The AUI (Anthropic AI Usage Index) gauges whether AI usage in a region is over- or underrepresented in relation to its working-age population, serving as a measure of intensity rather than a straightforward yes/no adoption indicator.
Why do smaller, wealthier countries excel by AUI?
High AUI levels typically coincide with robust digital infrastructure, a significant knowledge economy, supportive regulations, and enhanced public access to AI tools—all factors closely linked to economic prosperity.
If 40% of workers use AI, why do business surveys report single-digit adoption?
Employee-reported usage can be prevalent even when formal integration within companies is limited. Surveys may reflect whether AI is employed for producing goods or services, which sets a higher standard than general task use.
Are enterprises truly less cost-sensitive?
Preliminary evidence indicates a low sensitivity to task costs, with organizations favoring capabilities offering high value over minor cost differences. Over time, as scaling occurs, procurement and cost efficiency will likely become more significant.
What initial steps should lagging regions take?
Emphasis should be placed on strengthening digital infrastructure, enhancing local training programs, and initiating projects that extend beyond coding into diverse fields like education and business.
Conclusion: Navigating Uneven AI Outcomes
While the diffusion of AI technology is accelerating, the growth is uneven across various regions and tasks. The AEI illustrates how AI usage is concentrated and evolving towards more automated processes. Without deliberate efforts to enhance skills, infrastructure, and context, the advantages of AI are likely to remain concentrated among those regions and organizations best equipped to utilize it.
Fortunately, these patterns are not set in stone. As tools become more refined and complementary innovations emerge, there’s potential for more widespread adoption. The AEI’s thorough insights offer leaders a roadmap for assessing where their organizations stand, recognizing widening gaps, and crafting strategic responses.
Thank You for Reading this Blog and See You Soon! 🙏 👋
Let's connect 🚀
Latest Insights
Deep dives into AI, Engineering, and the Future of Tech.
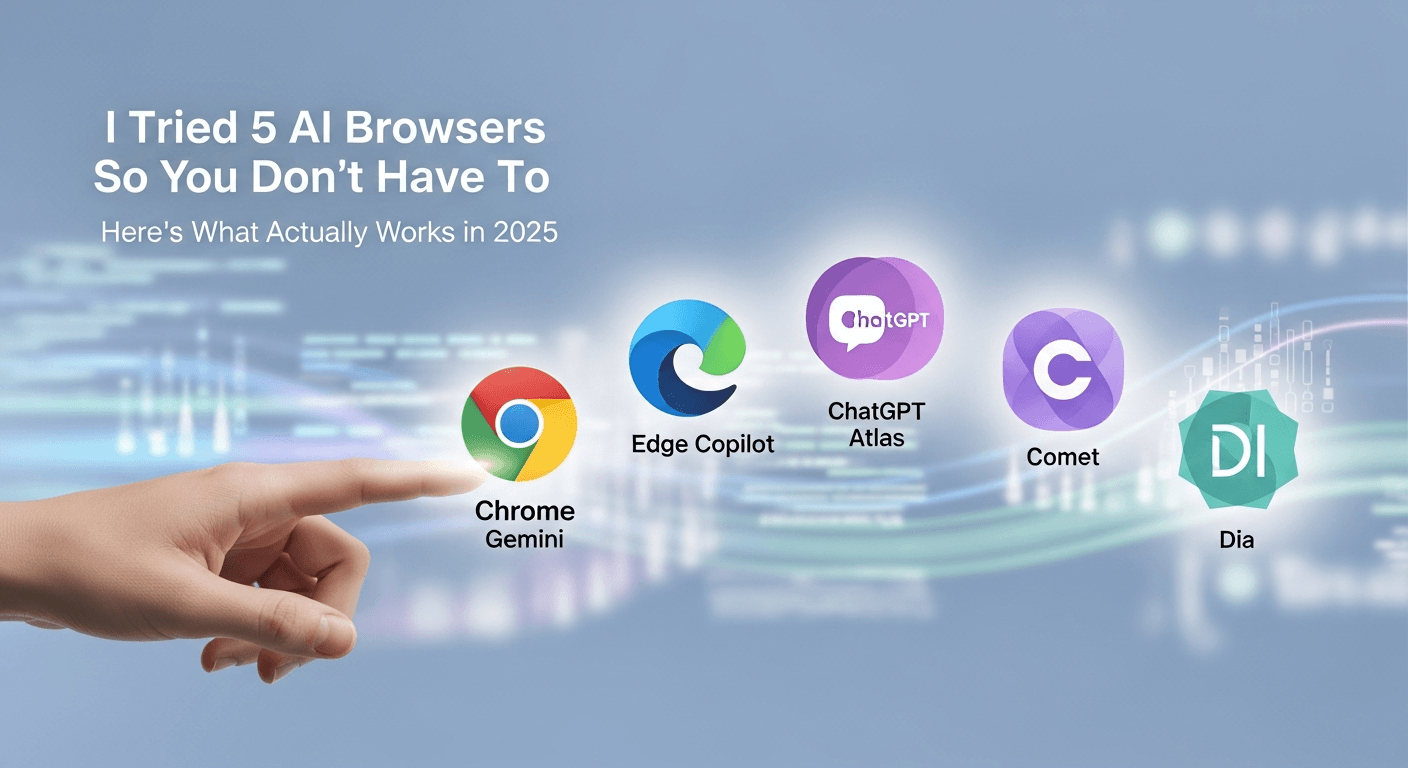
I Tried 5 AI Browsers So You Don’t Have To: Here’s What Actually Works in 2025
I explored 5 AI browsers—Chrome Gemini, Edge Copilot, ChatGPT Atlas, Comet, and Dia—to find out what works. Here are insights, advantages, and safety recommendations.
Read Article


